
Be the domainless master of your own domain
Many times I need to test a project on different operating systems, preinstalled or not preinstalled with specific components (e.g. a 32 bit project built with Windows 7 x64, run on a Windows XP x64 or x86, without an installation of the .NET framework runtime environment) and see how it behaves. And in many cases it would misbehave.
In such cases I'd like to inspect my errors in order to repair them. And in many cases this is no easy task. It's sometimes hard to trace the problems without a proper debugger. It's possible, of course, to install a complete development environment on my test machine, but that would be heavy, take disk space and memory, and in many cases would be quite an overkill.
Fortunately, Microsoft provides the platform and tools for remotely debugging your application. Unfortunately, accessing a remote machine for debugging requires appropriate permissions, and the remote debugging tools are planned to work when both computers share a domain and can work with common domain users.
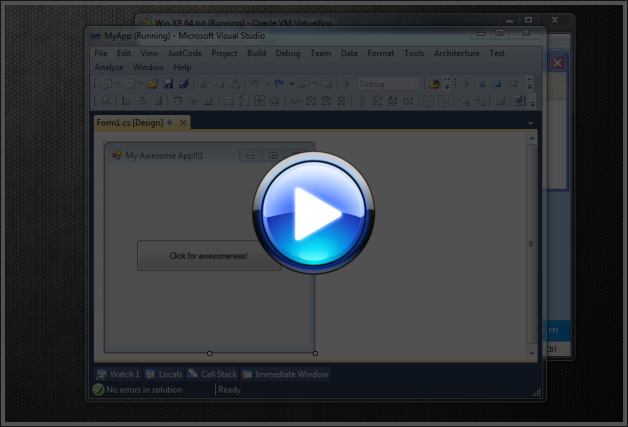
A common (and economic) trick for testing an application on multiple environments is by using a virtual machine. I can run several virtual machines on my computer, each with a different setup and a different OS. In order to achieve remote debugging, I'd theoretically need to set up a domain server, and start managing users among my virtual machines (or use a real network, such as the one in my workplace, in order to log in as a domain user, given sufficient privileges on the virtual machine). However, there are tricks to work around this requirement. I'll demonstrate how to run remote debugging from my local machine (not attached to any domain) to a virtual machine (running on its own detached workgroup). Click to see the wonder in action:
Obviously an index was exceeding the bounds of some array. Absolutely valuable information, which will not always be available upon crash, especially if your project is big enough. In any case, we need to know where this exception is thrown and why.
Article level: Not quite rocket science

Crash course in virtual machine's mechanics' crashes
There are a few common options for the choice of a virtual machine.
It's possible to use the robust VMware Workstation. Stingy VMware fans will be happy to know it's possible to use VMware machines for free, by using the free VMmanager (depracated) in order to create the machine and the free VMware Player in order to run it.
Another popular free option is Microsoft's free Virtual PC (partially depracated), which is nice and neat and just like other Microsoft products, it works well most of the time.
For my virtual machines I use Oracle's VirtualBox. It's free (open source), supports multiple platforms (there are x86 and x64 host versions for Linux, OS X, Solaris and Windows), it's comfortable and works nicely.
Terminology
The primary computer on which the virtual machine is installed is usually referred to as the host.
The machine which runs on the virtual environment (not knowing it's virtual) is usually referred to as the guest.
The demonstrated faulty app
My test project is a 32 bit winform application, built under Windows 7 x64 and Visual Studio 2010 on my virtual machine host. For this demo, I'll be debugging it on a guest virtual machine installed with Windows XP x64 and no Visual Studio.
Preinstall the remote debugging components
In order to connect with a debugger to the virtual machine, you will need to install the Microsoft Visual Studio Remote Debugger on it, which can downloaded from this link (for Visual Studio 2010).Networking your way to success
In order to remote-debug, both machines need to be able to access each other.
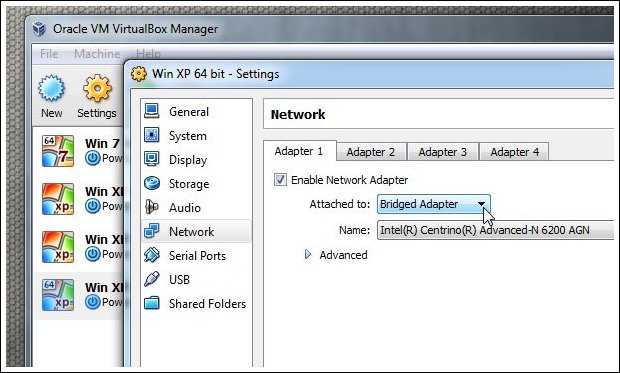
The guest machine needs to have an IP address which is accessible from the host. As a first step, I open the settings of the guest machine and change its adapter settings from the default NAT (Network Address Translation) to Bridged Adapter.
If you are behind a router, both the host and the guest should be assigned a valid IP in the local area network (e.g. 192.168.1.107 and 192.168.1.110).
Pings on the wing
One common method to make sure both computers are able to communicate with each other is the good old Ping. Here I'm trying to ping the guest in the VM from the host:

Oh, that didn't seem to work very well...
Of course, if you are running a virtual machine, you may just disable the firewall on it completely. If you still need the firewall to be there for some reason (e.g. your application's needs), you can let the pings in.
In order to let pings into the virtual machine, while its firewall is active, go to the firewall settings:
- On Control Panel Network Connections
- Find the Local Area Connection
- Right-Click Properties
- Go to the Advanced tab
- Click the Settings button of the Windows Firewall
- Go to the Advanced tab
- Click the Settings button of ICMP
- Make sure the "Allow incoming echo request" checkbox is checked.
Now ping should pass...

That's more like it. The 2 machines can access each other.
Additional firewall settings
If you are debugging a local virtual machine, the easiest thing to do would be taking down its firewall altogether.
If this is not an option, or you wish to leave it on for the remote debugging session, there are some additional specific steps to be taken in order to properly configure it. Here are instructions for Windows XP here, for Windows Vista here and for Windows 7 here.
Additional information/systems here.
PDB is my co-pilot
If you check the content of your application's output Bin folder, you should find, in addition to the built .exe/.dll assembly, a .PDB (Project Database) file, which contains debug info about your assembly. This link contains a nice elaborate post about the importance of PDB files.
The bottom line is that the PDB file is required to be present next to your debugged assembly (either locally or on the remote virtual machine) so that the debugger can relate the executing assembly to its debug info, and thus to attach and debug your code.

PDBs are produced by default (at least in Debug configuration).
In order to make sure the PDB file is produced for your assembly:
- Go to your project's properties
- Select the Build tab
- In the Configuration drop-down, select your build configuration (Debug / Release)
- Click the Advanced button
- Inspect the Debug Info drop-down
- You should have either "full" or "pdb-only" selected according to your needs.

Once you have the PDB of the assembly you wish to debug, copy it to the virtual machine, next to the built assembly.

Ghosts of users without a home
As stated above, in normal work environments (e.g. common workplace), there is usually a domain controller involved, and it's possible to log on a single user account to operating systems of both host machine and the guest virtual machine. I'm working without a domain server, but still I need to establish some trust between the host computer and the guest virtual machine. Being lazy (also as stated many times), and sometimes working on projects outside my workplace environment, I wish to run the remote debugging environment in the comfort of my living room, which is the reason I'm using a virtual machine in the first place.
The operating system on the virtual machine is a member of its own separate workgroup, and so is the one on my main host operating system. With this configuration, if I try to run the remote debugger in the virtual machine and attach to its process from the host, I may fail miserably with an error message stating:
"Unable to connect to the Microsoft Visual Studio Remote Debugging Monitor named '<VM IP>'. Login failure: unknown user name or bad password. See help for more information.".

The way around this error, as MSDN states, is to have a local user account on each of the machines, and both accounts must have the same user name and password. Fair enough.
The double life of a double agent
I'll add a new user with the name debugger (and password debugger) to each of my machines. Those are unrelated local accounts which just happen to have the same credentials.
 and on the guest (right)")
The double agent goes under cover
Great! Now every time I start my computer (the host machine), I'll have an extra user listed on the Welcome screen. However, I never want to actually log on as "debugger". I can still run Visual Studio under under the credential of the debugger user without explicitly logging in (more about that later).
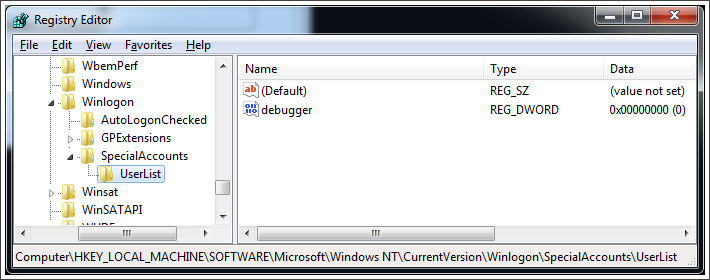
This annoying un-European behaviour, can be disabled via a simple trick in the Registry editor:
- Open Registry editor (Regedit.exe)
- Navigate to:
HKEY_LOCAL_MACHINE \ SOFTWARE \ Microsoft \ Windows NT \ CurrentVersion \ Winlogon \ SpecialAccounts \ UserList - (Note: if any of the above keys/subkeys does not exist, create them yourself).
- Create a new DWORD value. Name it the same name of the user you wish to hide (in my case, "debugger"), and make sure its Data value is kept as 0 (or set it to 0, if it's already there with a different value).
- In order to unhide the user, the Data value should be set to 1.
This trick works on Windows 7, Vista and XP. Thus it's effective on both my host (Windows 7 x64) and on my virtual machine (Windows XP x64). The debugger user account will be there but won't appear on the Welcome screens.
The double agent takes another person's identity
Now with the hidden user I can run Visual Studio under the debugger user account.
In order to do that without actually logging in as the debugger user, we can use Windows built-in impersonation tool, RunAs, a console application which usually resides in the System32 folder.
RunAs is cool because it has many options.
It's not cool because it requires the user to enter their password every time (which as one can guess, I find a nuisance).
Hence I've produced a small utility of my own, named RunAsWithCredentials, which allows entering the password as a command line argument.
Using it is quite easy, all you need to do is specify the username, password, executable and optional command line switches for executing (specifying a domain name is optional). Running it without command line switches produces a useful help message
(It also has an unlisted Easter egg(!!!)).
For example, in order to run Visual Studio under the credentials of my debugger user:
RunAsWithCredentials.exe /user:debugger /pass:debugger "C:\Program Files (x86)\Microsoft Visual Studio 10.0\Common7\IDE\devenv.exe"
And I can create a shortcut so that I can start Visual Studio in "remote debug" mode whenever I need:
Note that it's possible to export all your Visual Settings when running with your default user account, then import them when Visual Studio is running under the credentials of the debugger user. Thus you'll have access to all your usual add-ons and settings, while faking it as someone else, and the usability should be smooth.
A small hiccup with Visual Studio:
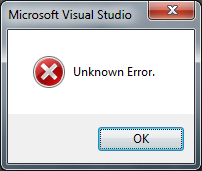
In the first times I tried to run Visual Studio with my debugger user, I got a strange unexplained "Unknown error" messagebox, and Visual Studio failed to start. This happened both when I used my RunAsWithCredentials and when I used the Windows RunAs.
What I did to resolve this (on my host machine, where I need to run Visual Studio):
- Unhid the debugger user from the Welcome screen, using the reverse of the registry trick above.
- Logged in as the debugger user (to create a profile).
- Opened Visual Studio under the debugger user's profile (this was successful).
- Logged out debugger and re-logged in as my default user.
- Ran Visual Studio using RunAsWithCredentials as debugger user with /SafeMode command-line switch (this was successful).
- From then on, Visual Studio managed to run under the credentials of the the debugger user, with RunAsWithCredentials, smoothly without crashing and without the need for the safe mode switch.
- I re-hid the debugger user again from the Welcome screen, using the registry trick above.
The code for RunAsWithCredentials is attached at the bottom of this article.
The long and winding road to happiness
Allow the debugger user account to debug application
Now that we have a special user, debugger, it's important to allow that user account to debug applications.
On the virtual machine:
- Go to the Control Panel Administrative Tools.
- Open Local Security Policy.
- On the left hand side tree navigate to: Security Settings Local Policies User Rights Assignment.
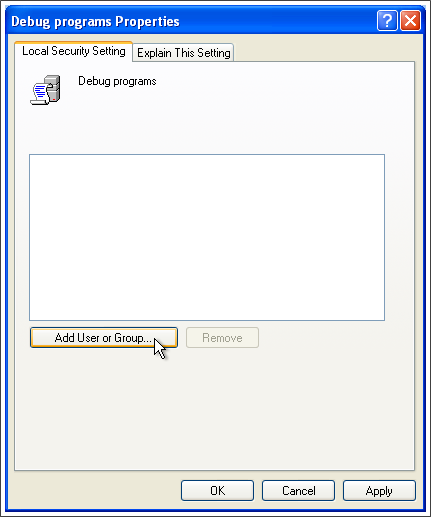
- On the right hand side list, under the Policy column, locate "Debug programs" and double-click it.

- In the dialog that pops up, click "Add User or Group...", then choose the user to allow debugging.
Attempt debug
So far I have what it takes to start the remote debugging session.
Or so I thought. There's more than meets the eye here. I'll list some potential problems along the long and winding road to happiness.
First, let's break down the steps of the remote debugging session:
On the guest virtual machine:
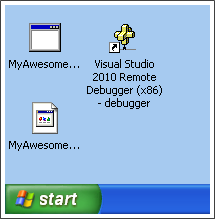
The Remote Debugger must now run under the credentials of the debugger user. I have placed a convenient shortcut on the virtual machine's desktop, which impersonates the user with my RunAsWithCredentials app.
Thus, the first step is to start Visual Studio 2010 Remote Debugger (x86 version, since I'm debugging a 32 bit executable, although my virtual machine runs a x64 operating system):
In my case, I also get a warning about running x86 version of the debugger on a x64 environment. This is not a problem:
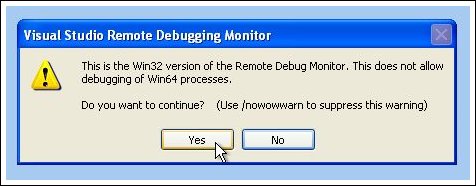
The following message which appears right after this dialog is a problem:
"Visual Studio Remote Debugging Monitor will not be able to debug applications because the 'Network access: Sharing and security model for local accounts' local security policy option is set to 'Guests only - local users authenticate as Guest'. This can be configured with the 'Local Security Settings administration tool."
(If you didn't get this dialog, you're doing fine! skip to the next step).
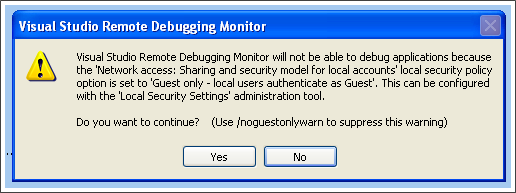
I click No (not to continue), and resort to resolve this issue first. This error message is great because it gives a detailed description of the problem and how to fix it. So here is how:
- Go to the Control Panel Administrative Tools.
- Open Local Security Policy.
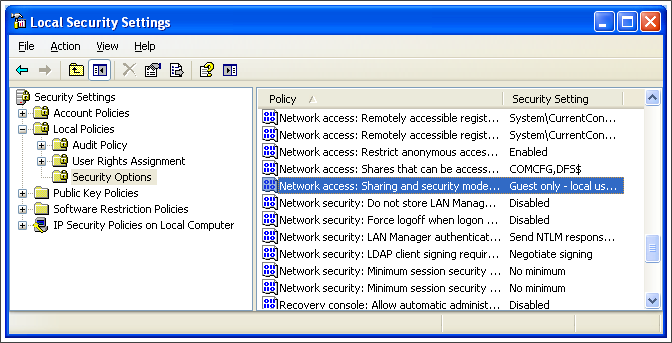
- On the left hand side tree navigate to: Security Settings Local Policies Security Options.
- On the right hand side list, under the Policy column, locate "Network access: Sharing and security model for local accounts" and double-click it.
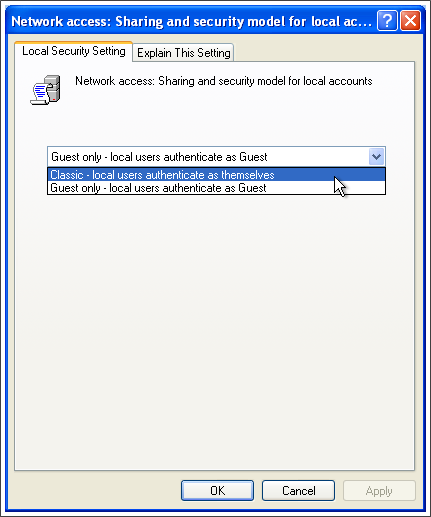
- In the dialog that pops up, select the option "Classic - local users authenticate as themselves", then click OK and close all windows.
Now I should be able to run both the Visual Studio 2010 Remote Debugger under the debugger user credentials, and the debuggable application on the virtual machine (under the default logged in user credentials, not necessarily the debugger user).
This is how it looks like on my machine:

And with this little triumph, we can turn to the host machine.
On the host machine:
- Open Visual Studio 2010 with the credentials of the debugger user. I'm lucky to have a shortcut. Remember?
RunAsWithCredentials in a comfortable desktop shortcut
- RunAsWithCredentials in a comfortable desktop shortcut
- Open the solution of the application to debug.
- Open the Attach to Process dialog.
- Either through Visual Studio's main menu Debug Attach to Process...
or by pressing the default hotkey combination: Ctrl+Alt + P.
In the Qualifier textbox fill the IP of the virtual machine and press Enter.
 Attach to remote process (click for full size screenshot)
 - The processes on the virtual machine should appear in the list after a sec or two.
If your debugged application is not listed under Available Processes make sure both checkboxes in the bottom of the Attach to Process dialog are checked:
"Show processes from all users" and "Show processes in all session".
Find the process of the application to debug in the list and double click it. Choose the app to debug (click for full size screenshot)
 - Approve attaching to the remote process on the following dialog:
 Approve the attachment to the remote process
 - Now we are debugging it! (click to see animated screen capture)
 Ah! Here is my error! (click for full size screen capture)
Bizzaro world - Running Remote Debugger as a service
In some cases it's needed to remote debug a service (such as ASP.NET over IIS), or a process which runs on Session 0, or there may be a scenario where we don't want or, for some reason, can't run the Remote Debugger as a regular application. In such cases we can run Remote Debugger as a service.
Remote Debugger service can also work for debugging regular applications, not just the cases described above.
Setting up the user's rights
We need to connect the debugger user account to the Remote Debugger service, in order to allow the two sides of the remote debugging session to connect. This is a similar requirement to the one I mentioned in the above paragraphs.
The first thing needed here is to allow the user to log on as service:
- Go to the Control Panel Administrative Tools
- Open Local Security Policy.
- On the left hand side tree navigate to: Security Settings Local Policies User Rights Assignment.
- On the right hand side list, under the Policy column, locate "
Log on as a service " and double-click it.
 Log on as a service
 - In the dialog that pops up, click "Add User or Group...", then choose the user to allow logging on as a service.
 Add the user
Setting up the service
- Setting up the service is as easy as running the "Visual Studio 2010 Remote Debugger Configuration Wizard" which resides in the start menu.
 Start the Visual Studio 2010 Remote Debugger Configuration Wizard
 - The wizard allows setting the user under whom the service will run, so I can associate it with the local debugger user account.
 Run the service under the right user account
 - Another setting the wizard configures is the option to allow computers outside the network to remote debug. This may be required in scenarios of isolated environments, such as the one discussed here.
 Allow any computer to debug
 - Now the service is in place.
 The service is set
Troubleshooting the service I - Kerberos authentication error
If you're trying to connect Visual Studio to the Remote Debugger on the virtual machine, while it's running as a service, you may encounter the following error message:
"Unable to connect to the Microsoft Visual Studio Remote Debugging Monitor named '<IP Address>. The Visual Studio Remote Debugger on the target computer cannot connect back to this computer. Kerberos authentication failed. Please see Help for assistance."

The reason for this error is a mismatch between the user account running the service and user account trying to connect to it from Visual Studio.
As stated above, the user account name and password must match between Visual Studio on the host machine and the Remote Debugger service on the virtual machine.
The easiest way to set the service account credentials is to use the Remote Debugger configuration wizard as explained above.
Another option is to locate the service in the list of services:
- Control Panel Administrative Tools Services.
- Double-click the Visual Studio 10 Remote Debugger service,
- Go to the Log On tab, and set the right user account:
 Set the service user account
Troubleshooting the service II - 32/64 Bit application debugging
If you're trying to connect Visual Studio to the Remote Debugger on the virtual machine, while it's running as a service, you may encounter the following error message:
"Unable to attach to the process. The 64-bit version of the Visual Studio Remote Debugging Monitor (MSVSMON.EXE) cannot be used to debug 32-bit processes or 32-bit dumps. Please use the 32-bit version instead."

This means the service is using the wrong version of the Remote Debugger executable. It's possible to replace the service executable to match the debugged application.
This can be done with the Service Controller application, SC.EXE, which resides by default in the System32 folder.
- The 64-bit of Remote Debugger installs both 32 and 64 versions.
Those, by default, reside in separate folders, x86 and x64, under "%programfiles%\Microsoft Visual Studio 10.0\Common7\IDE\Remote Debugger". - There are 2 executables used on the Remote Debugger service:
rdbgservice.exe - is used to run the debugger in service mode.
msvsmon100.exe - is the Remote Debugger service executable.
(note: 100 denotes the version: Remote Debugger 10.0, which matches Visual Studio 2010. The previous version, for example was msvsmon90.exe).
If is rdbgservice.exe missing in one of the folders, x86 or x64, it needs to be copied manually to where it's missing.
- Stop the service. In command prompt, this can be achieved with the SC utility:
sc.exe stop msvsmon100 - Replace the service path:
(Note the space between binPath= and the actual path).
To set 32 bit debugging:
sc.exe config msvsmon100 binPath= "%programfiles%\Microsoft Visual Studio 10.0\Common7\IDE\Remote Debugger\x86\rdbgservice.exe msvsmon100"
To set 64 bit debugging:
sc.exe config msvsmon100 binPath= "%programfiles%\Microsoft Visual Studio 10.0\Common7\IDE\Remote Debugger\x64\rdbgservice.exe msvsmon100"
Start the service:
sc.exe start msvsmon100